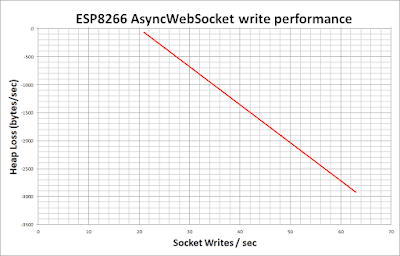
That's no great surprise, but it may help other folk to know what the limit is. Bear in mind that the following examples were deliberately throwing a sustained rate of writes with no pause for recovery. In the normal course of events where socket writes are fairly random, there won't be so much of an issue. My app sends socket writes to flash the pins on and off in "real time" and also updates the sliding graphs, the UpTime and the pusling heartbeat. So there is a continual "background" of 3/sec even with no GPIO pin activity.
 |
| Esparto V2 web UI, dynamically updating system panel running on Wemos D1 min |
If you connect a noisy sensor to an input pin (e.g. a sound sensor that fires thousands of pin transitions per second) a crash is the obvious result and so each pin can be "throttled" to avoid problems. It was in trying to find a "safe" throttling value that I generated the graph and I hope others will find it useful.
 |
For example, say you start with 30k free heap. Some part of your code fires a burst of socket writes at 50 per second. Reading up from 50 and then back to the vertical axis you will see that about 2kb heap per second will be consumed, giving you 30 / 2 = 15 seconds before you crash.
If you can organise your app so that it backs off before that time and allows the heap to recover back to 30k then you can safely repeat the process.
Also you can see that once the rate drops, the heap recovers rapidly, so bear this in mind when designing you app and try to minmise socket writes.
I created a lot of problems for myself early on by trying to load the whole UI as a monlithic block, with 40,50, 60 or more socket writes to set it up as soon as the socket opened. Trying to get round this problem led me to the rate throttling method I now use, thanks to the data behind this post.
A technique I use to update all four sliding graphs (1x per sec) as well as the current, min and max figures for each graph is by combing all those values into a single write and allowing the browser Javascript to parse, spilt and distribute them accordingly.
Another technique is to build in pauses between groups of writes. I use "lazy loading" of the web UI. It loads in 5 sections, each doing a chunk of work then scheduling the next chunk a short while later. The "short while" is of course calculated using the above graph! Yes, this makes the UI a little slow to load, but it doesn't crash!
Further, only the "active panel" is loaded on inital AsyncWebServer request. In my case it's the WiFi configuration panel (curently hidden behind the graph panel) . Each of the six icons at the top left of the lower panel will cease any socket activity to the current panel, hide it, show the new panel over the top and start any dynamic updating with socket writes for the new panel. Thus socket writes are only sent for the panel that is currently visible.
For further info feel free to contact me @ esparto8266 -at- gmail.com
No comments:
Post a Comment